
Many people in the United States are in debt, with a significant portion stemming from student loans.
As education costs rise, many exhaust federal loan options and turn to private loans.
This guide provides insights into key student loan debt statistics. This will help you understand what to expect if you’re considering borrowing and assess your current debt situation.
Key Takeaways
- US student loan debt reached $1.773 trillion in 2024, an 8.75% increase from 2023, driven by rising education costs.
- The average student loan debt in the US is $35,207, varying significantly by state and degree type (e.g., $29,300 for a Bachelor’s vs. $296,500 for dental school).
- Federal student loan debt (subsidized/unsubsidized) comprises the largest portion of student debt, with private loans accounting for a smaller percentage.
- Student loan debt affects all age groups, with significant balances even among those 62 and older, highlighting the long-term impact of borrowing.
How Much Do Students Owe on Average in the U.S.?
According to the Education Data Initiative, students in the United States collectively owned around $1.773 trillion in student debt in 2024. This is 8.75% over 2023’s collective student loan, which was around 1.6 trillion.
This percentage might seem small, but when we’re talking about trillions like this, that 8.75% reflects $173 billion. To illustrate the scale, consider this calculation:
1,773,000,000,000−1,600,000,000,000 = 173,000,000,000
This gigantic number stems from the increasing cost of education in the U.S., with the yearly cost of one year in college in the nation averaging $38,270 per student. Note that this number includes the fees, supplies, books, and expenses.
Extending that cost over four years, assuming no failed courses, totals $153,080. That doesn’t even consider out-of-state students, who pay $45,708 per year ($182,824 per four years).
Even with part-time work, covering these expenses often requires borrowing.
Here are the statistics for the last 12 years for further reference:
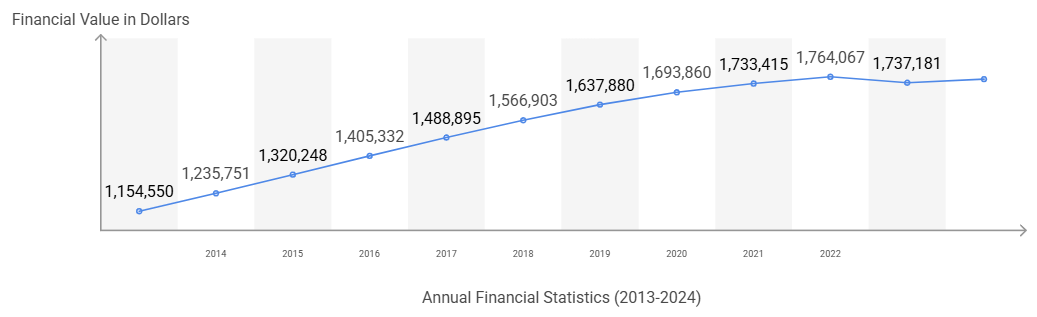
- 2024: $1,753,333
- 2023: $1,737,181
- 2022: $1,764,067
- 2021: $1,733,415
- 2020: $1,693,860
- 2019: $1,637,880
- 2018: $1,566,903
- 2017: $1,488,895
- 2016: $1,405,332
- 2015: $1,320,248
- 2014: $1,235,751
- 2013: $1,145,550
Source: The Federal Reserve
What Is the Average Student Loan Debt in the United States?
In 2024, the average student loan (average federal student loan and private loan) in the United States was $35,207. Here’s how the stats are by state:
| State | Average Student Loan Debt per Borrower |
| Alabama | $37,390 |
| Alaska | $35,350 |
| Arizona | $35,510 |
| Arkansas | $33,620 |
| California | $37,810 |
| Colorado | $37,110 |
| Connecticut | $36,480 |
| Delaware | $38,030 |
| District of Columbia | $54,150 |
| Florida | $38,860 |
| Georgia | $38,340 |
| Hawaii | $38,158 |
| Idaho | $33,281 |
| Illinois | $39,055 |
| Indiana | $33,243 |
| Iowa | $30,925 |
| Kansas | $33,119 |
| Kentucky | $33,470 |
| Louisiana | $34,866 |
| Maine | $34,292 |
| Maryland | $43,692 |
| Massachusetts | $35,529 |
| Michigan | $36,974 |
| Minnesota | $34,071 |
| Mississippi | $37,254 |
| Missouri | $35,675 |
| Montana | $33,945 |
| Nebraska | $32,377 |
| Nevada | $34,589 |
| New Hampshire | $34,884 |
| New Jersey | $37,201 |
| New Mexico | $34,280 |
| New York | $38,690 |
| North Carolina | $38,695 |
| North Dakota | $29,647 |
| Ohio | $35,033 |
| Oklahoma | $32,103 |
| Oregon | $37,829 |
| Pennsylvania | $36,267 |
| Rhode Island | $33,270 |
| South Carolina | $38,770 |
| South Dakota | $30,928 |
| Tennessee | $36,886 |
| Texas | $33,581 |
| Utah | $33,746 |
| Vermont | $38,404 |
| Virginia | $40,137 |
| Washington | $36,762 |
| West Virginia | $32,358 |
| Wisconsin | $32,628 |
| Wyoming | $31,503 |
Source: Education Data Initiative
Related: How Much Student Loan Can I Get?
Does the Student Loan Differ By Degree?
Yes, and the differences can be significant. For example, the average student loan debt for a Bachelor’s Degree is $29,000. On the other hand, Dental School debts have a remarkably higher average of $296,500. Here are the numbers:
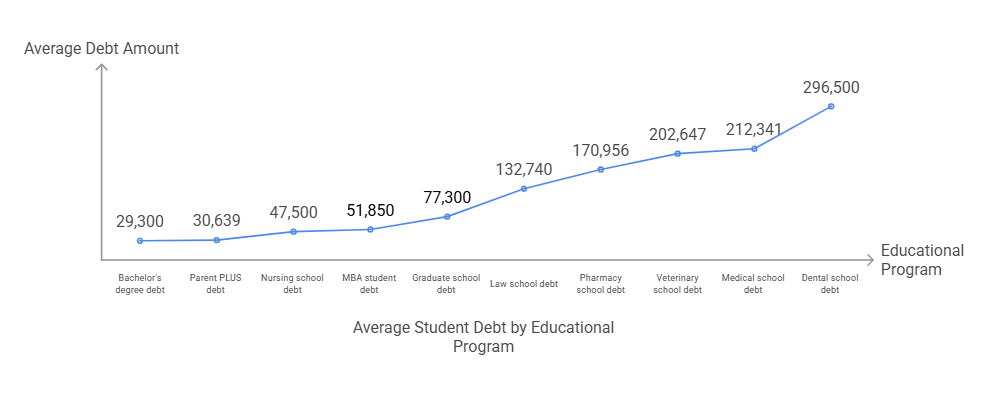
| Debt Type | Average Debt |
| Bachelor’s degree debt | $29,300 |
| Parent PLUS debt | $30,639 |
| Nursing school debt | $47,500 |
| MBA student debt | $51,850 |
| Graduate school debt | $77,300 |
| Law school debt | $132,740 |
| Pharmacy school debt | $170,956 |
| Veterinary school debt | $202,647 |
| Medical school debt | $212,341 |
| Dental school debt | $296,500 |
Source: Education Data Initiative
Related: How Does Student Loan Interest Work
Student Loan Statistics Per Loan Type
There are various types of loans in the nation, with federal loans (direct subsidized and unsubsidized) loans making up the biggest chunk.
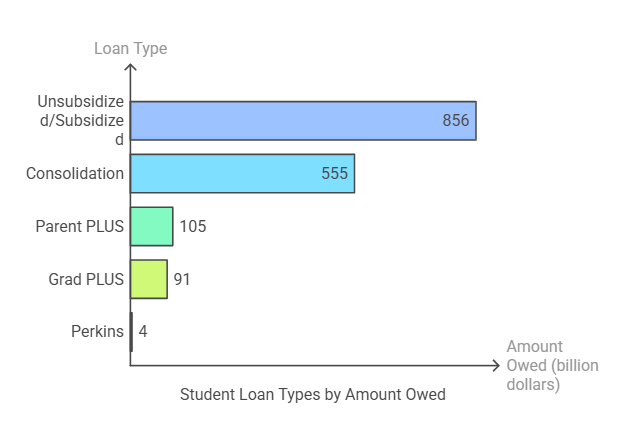
| Loan Type | Amount Owed | Borrowers |
| Unsubsidized/Subsidized | $856 billion | 34 million |
| Consolidation | $555 billion | 11.3 million |
| Parent PLUS | $105 billion | 3.7 million |
| Grad PLUS | $91 billion | 1.6 million |
| Perkins | $4 billion | 1.5 million |
Source: Federal Student Aid
Private Student Loan Statistics
Private student loans offered by banks, lenders, and credit unions typically command higher interest and less flexible payment plans compared to government-backed student loans. That’s why they’re far less utilized compared to federal student loans.
The total outstanding private student loan debt is around $130.28 billion as of Q3 2023, accounting for about 7.61% of the total student loan debt ($1.77 trillion).
In the 2022–2023 academic year alone, students and parents borrowed around $98.2 billion in private loans, with undergraduates making up nearly 89.1% of this borrowing.
As for graduates of the same academic year, approximately 51% of them from four-year public and nonprofit colleges left school with an average debt of $29,300.
Related: Private Student Loan Forgiveness
Student Loan Statistics Per Age Group
Logically, older individuals should have less student debt due to more repayment time.
However, this isn’t the case in the past years, as 2.4 million people of 62+ years in the United States still collectively owe $98 billion. Here are the full states sorted by age groups:
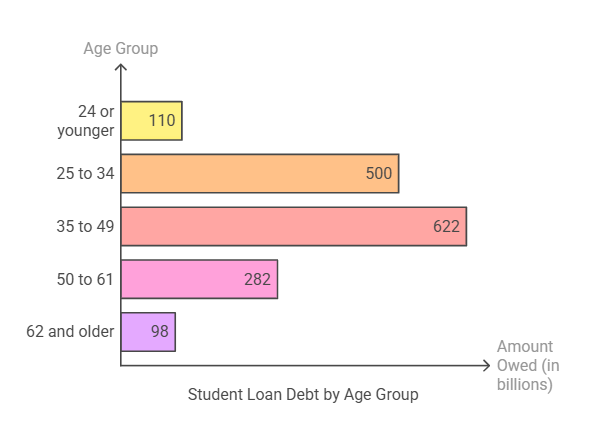
| Age Group | Amount Owed | Number of Borrowers |
| 24 or younger | $110 billion | 7.6 million |
| 25 to 34 | $500 billion | 14.9 million |
| 35 to 49 | $622 billion | 14.4 million |
| 50 to 61 | $282 billion | 6.4 million |
| 62 and older | $98 billion | 2.4 million 1 |
Source: Federal Student Aid
Student Loan Forgiveness Programs Statistics
Many student loan borrowers are eligible to have their student loan forgiven using various programs and forgiveness plans, especially after years of constant payments. Here are some of them:
Income-Driven Repayment Plans (IDRs)
IDR plans include monthly payments that are based on your income and family size, with the remaining balance forgiven after 20–25 years of payment. The IDR plan forgave a total of $51 billion for over 1 million borrowers.
SAVE Plans
SAVE is the newest IDR plan, with lower payments and faster forgiveness than traditional IDR plans. SAVE plans have forgiven a total of $5.5 billion for over 414,000 borrowers.
Total and Permanent Disability Discharge
This program forgives loans for borrowers who are permanently disabled, as verified through Social Security Administration documentation (SSA), Veterans Affairs determination (VA), or Physician documentation. This program saved over $14.1 billion for 548,000 borrowers.
Borrower Defense
This program provides forgiveness if your school misled or defrauded you through misconduct or false claims. You’d be surprised that over $28.7 billion was forgiven because of misleading claims for over 1.6 million borrowers.
Additional Interesting Student Loan Debt Statistics
- 0.2% of the total student loan debt comes from Perkins loans, 6.8% comes from Grad Plus, and 6.7% comes from Parent Plus.
- A total of 31.6% of federal student loans come from direct consolidated loans.
- A large 54.7% of the total federal student loan borrowers utilize Stafford Loans.
- 28% of undergraduates utilize federal loans, and a much bigger 61% of graduates borrow federal loans as well.
- On the other hand, 90.70% of undergraduates utilized private student loans, and only 9.3% of graduate students did the same.
- 92.45% of undergraduate loans have co-signers. Graduate students have a considerably lower co-signer percentage of 68.46%.
- 24% of students in debt have education-related debt (besides student loans).
- Female bachelor’s degree holders borrow 3.63% more in student loans compared to their male counterparts.
- Black/African American students are much more likely to utilize federal student loans with a percentage of 82.9%. They also owe an average of around $25,000 more than Caucasian borrowers after four years of graduation.
- 25% of people in the age group (18–29) report being in student loan debt. The percentage in the following age group (30–44) is lower at 14%.
- More than 33% of federal borrowers are in the age group of (25–34).
Source: Educational Data Initiative
Get Your Own Expertly Given Student Loan Debt Advice
Student loan statistics go much deeper than we’ve explained. If anything, we barely scratched the surface and you already have a good idea of the latest student loan statistics in the United States.
Most people will need to rely on both federal and private loans at some point, making expert guidance essential. The statistics above show that the loan game isn’t for the uneducated.
Get expert advice from the Student Loan Professor. Simply contact us and fill us in with the details of your own situation, and we’ll help you get the best possible loan and guide you to pay it back effectively.
Also Read: Do You Have to Pay Student Loans While in School
Brandon Barfield is the President and Co-Founder of Student Loan Professor, and is nationally known as student loan expert for graduate health professions. Since 2011, Brandon has given hundreds of loan repayment presentations for schools, hospitals, and medical conferences across the country. With his diverse background in financial aid, financial planning and student loan advisory, Brandon has a broad understanding of the intricacies surrounding student loans, loan repayment strategies, and how they should be considered when graduates make other financial decisions.
